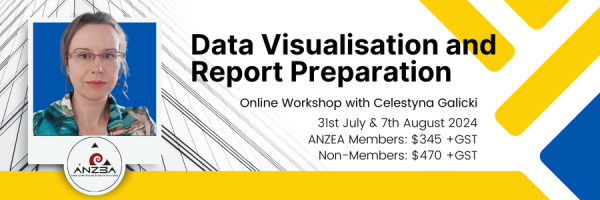
A two part workshop presented by Celestyna Galicki.
This workshop is offered as two 3-hour online sessions, to be held on consecutive weeks.
Session one: Report writing and information design for audience impact
Session two: Visualising quantitative and qualitative data for evaluation reports
This workshop is offered as two 3-hour online sessions, to be held on consecutive weeks.
Session one: Report writing and information design for audience impact
Session two: Visualising quantitative and qualitative data for evaluation reports
Session one: Report writing and information design for audience impact
Participants will learn a reliable process for selecting the right information to include in the evaluation report and how to structure this information to make the report easy to read and engaging for the audience.
- Writing to answer the questions for different audiences: the doers and the decision-makers, the specialists and the generalists
- What it means to communicate on a strategic level; when to show the detail and when to summarise
- Distributing the information across the summary, report sections and appendices
- Layering information for different audiences for easy navigation
- How to drop the academic habit of "defensive writing"
- Using the Schwartz values map to make the report relatable for your audience
- basic best practices for layout, illustration, table of contents, tables and graphs
The participants will be invited to bring any writing they are currently working on to use in the interactive part of the workshop where we will put the skills into practice.
Session two: Visualising quantitative and qualitative data for evaluation reports
Participants will learn how to make their data easy to understand, impactful and engaging for audiences without a research or data background, and how to make their data-based reports look great.
- Which types of graphs to use when to maximise audience understanding and engagement
- Best practices for graph styling and annotation and pitfalls to avoid (including how the way data is presented can support biases and stereotypes)
- How to use the free tool Flourish to make responsive graphs, and how to make dot plots, violin plots, Sankey diagrams and other interesting visualisations
- How to use the free tool Datawrapper to make map-based visualisations, using New Zealand's Statistical Area 2, Regional Councils, electorates, and DHBs
- How to illustrate data on small maps (e.g. neighbourhood) using Datawrapper and Canva
- How to visualise qualitative data - themes, timelines, recommendations etc.
The workshop will include a practical component where participants can work on their own or provided data and immediately use their new skills with assistance from the facilitator.
Cost: This is a paid event organised by the Aotearoa New Zealand Evaluation Association. All prices are in NZD.
- ANZEA Members: $345 +GST
- Non-Members: $470 +GST
Please contact info@anzea.org.nz for more information.
About Celestyna Galicki
After completing her PhD at the University of Auckland Celestyna has worked in research, evaluation and insights roles across central and local government.
Testimonial:
“Celestyna led a really engaging workshop with our team on reporting and data visualisation. We came away inspired with great ideas and tools to better communicate our work.”
-Adrian Field, Director at Dovetail
-Adrian Field, Director at Dovetail
Please note that you will be prompted to create a profile when you register for any of our events. This is not the same as an ANZEA membership and is simply a way for you to easily access and manage your interactions with us.
